http://blog.csdn.net/chen3888015/article/details/7432868
在 Linux 下 top 工具可以显示 cpu 的平均利用率(user,nice,system,idle,iowait,irq,softirq,etc.),可以显示每个 cpu 的利用率。但是无法显示每个线程的 cpu 利用率情况,
这时就可能出现这种情况,总的 cpu 利用率中 user 或 system 很高,但是用进程的 cpu 占用率进行排序时,没有进程的 user 或 system 与之对应。
可以用下面的命令将 cpu 占用率高的线程找出来:
ps H -eo user,pid,ppid,tid,time,%cpu,cmd –sort=%cpu
这个命令首先指定参数’H’,显示线程相关的信息,格式输出中包含:user,pid,ppid,tid,time,%cpu,cmd,然后再用%cpu字段进行排序。这样就可以找到占用处理器的线程了。
proc文件系统
/proc 文件系统是一个伪文件系统,它只存在内存当中,而不占用外存空间。它以文件系统的方式为内核与进程提供通信的接口。用户和应用程序可以通过/proc得到 系统的信息,并可以改变内核的某些参数。由于系统的信息,如进程,是动态改变的,所以用户或应用程序读取/proc目录中的文件时,proc文件系统是动 态从系统内核读出所需信息并提交的。
/proc 目录中有一些以数字命名的目录,它们是进程目录。系统中当前运行的每一个进程在/proc下都对应一个以进程号为目录名的目录/proc/pid,它们是 读取进程信息的接口。此外,在Linux2.6.0-test6以上的版本中/proc/pid目录中有一个task目录,/proc/pid/task 目录中也有一些以该进程所拥有的线程的线程号命名的目录/proc/pid/task/tid,它们是读取线程信息的接口。
/proc/cpuinfo文件
该文件中存放了有关 cpu的相关信息(型号,缓存大小等)。
[zhengangen@buick ~]$ cat /proc/cpuinfo
processor : 0
vendor_id : GenuineIntel
cpu family : 15
model : 4
model name : Intel(R)Xeon(TM) CPU 3.00GHz
stepping : 10
cpu MHz : 3001.177
cache size : 2048 KB
physical id : 0
siblings : 2
core id : 0
cpu cores : 1
fdiv_bug : no
hlt_bug : no
f00f_bug : no
coma_bug : no
fpu : yes
fpu_exception : yes
cpuid level : 5
wp : yes
flags : fpu vme de psetsc msr pae mce cx8 apic mtrr pge mca cmov pat pse36 clflush dts acpi mmx fxsrsse sse2 ss ht tm pbe lm pni monitor ds_cpl cid xtpr
bogomips : 6004.52
说明:以下只解释对我们计算Cpu使用率有用的相关参数。
参数 解释
processor (0) cpu的一个物理标识
结论1:可以通过该文件根据processor出现的次数统计cpu的逻辑个数(包括多核、超线程)。
/proc/stat文件
该文件包含了所有CPU活动的信息,该文件中的所有值都是从系统启动开始累计到当前时刻。不同内核版本中该文件的格式可能不大一致,以下通过实例来说明数据该文件中各字段的含义。
实例数据:2.6.24-24版本上的
fjzag@fjzag-desktop:~$cat /proc/stat
cpu 38082 627 27594 89390812256 581 895 0 0
cpu022880 472 16855 430287 10617 576 661 0 0
cpu115202 154 10739 463620 1639 4 234 0 0
intr120053 222 2686 0 1 1 0 5 0 3 0 0 0 47302 0 0 34194 29775 0 5019 845 0 0 0 0 00 0 0 0 0 0 0 0 0 0 0 0 0 0 0 0 0 0 0 0 0 0 0 0 0 0 0 0 0 0 0 0 0 0 0 0 0 0 0 00 0 0 0 0 0 0 0 0 0 0 0 0 0 0 0 0 0 0 0 0 0 0 0 0 0 0 0 0 0 0 0 0 0 0 0 0 0 0 00 0 0 0 0 0 0 0 0 0 0 0 0 0 0 0 0 0 0 0 0 0 0 0 0 0 0 0 0 0 0 0 0 0 0 0 0 0 0 00 0 0 0 0 0 0 0 0 0 0 0 0 0 0 0 0 0 0 0 0 0 0 0 0 0 0 0 0 0 0 0 0 0 0 0 0 0 0 00 0 0 0 0 0 0 0 0 0 0 0 0 0 0 0 0 0 0 0 0 0 0 0 0 0 0 0 0 0 0 0 0 0 0 0 0 0 0
ctxt1434984
btime1252028243
processes8113
procs_running1
procs_blocked0
第一行的数值表示的是CPU总的使用情况,所以我们只要用第一行的数字计算就可以了。下表解析第一行各数值的含义:
参数 解析(单位:jiffies)
(jiffies是内核中的一个全局变量,用来记录自系统启动一来产生的节拍数,在linux中,一个节拍大致可理解为操作系统进程调度的最小时间片,不同linux内核可能值有不同,通常在1ms到10ms之间)
user (38082) 从系统启动开始累计到当前时刻,处于用户态的运行时间,不包含 nice值为负进程。
nice (627) 从系统启动开始累计到当前时刻,nice值为负的进程所占用的CPU时间
system (27594) 从系统启动开始累计到当前时刻,处于核心态的运行时间
idle (893908) 从系统启动开始累计到当前时刻,除IO等待时间以外的其它等待时间iowait (12256) 从系统启动开始累计到当前时刻,IO等待时间(since 2.5.41)
irq (581) 从系统启动开始累计到当前时刻,硬中断时间(since 2.6.0-test4)
softirq (895) 从系统启动开始累计到当前时刻,软中断时间(since2.6.0-test4)stealstolen(0) which is the time spent in otheroperating systems when running in a virtualized environment(since 2.6.11)
guest(0) whichis the time spent running a virtual CPU for guest operating systems under the control ofthe Linux kernel(since 2.6.24)
结论2:总的cpu时间totalCpuTime = user + nice+ system + idle + iowait + irq + softirq + stealstolen + guest
/proc/<pid>/stat文件
该文件包含了某一进程所有的活动的信息,该文件中的所有值都是从系统启动开始累计
到当前时刻。以下通过实例数据来说明该文件中各字段的含义。
[zhengangen@buick ~]# cat/proc/6873/stat
6873 (a.out) R 6723 6873 6723 34819 6873 8388608 77 0 0 0 41958 31 0 0 25 0 3 05882654 1409024 56 4294967295 134512640 134513720 3215579040 0 2097798 0 0 0 00 0 0 17 0 0 0
说明:以下只解释对我们计算Cpu使用率有用相关参数
参数 解释
pid=6873 进程号
utime=1587 该任务在用户态运行的时间,单位为jiffies
stime=41958 该任务在核心态运行的时间,单位为jiffies
cutime=0 所有已死线程在用户态运行的时间,单位为jiffies
cstime=0 所有已死在核心态运行的时间,单位为jiffies
结论3:进程的总Cpu时间processCpuTime = utime +stime + cutime + cstime,该值包括其所有线程的cpu时间。
/proc/<pid>/task/<tid>/stat文件
该文件包含了某一进程所有的活动的信息,该文件中的所有值都是从系统启动开始累计到当前时刻。该文件的内容格式以及各字段的含义同/proc/<pid>/stat文件。
注意,该文件中的tid字段表示的不再是进程号,而是linux中的轻量级进程(lwp),即我们通常所说的线程。
结论4:线程Cpu时间threadCpuTime = utime +stime
系统中有关进程cpu使用率的常用命令
ps 命令
通过ps命令可以查看系统中相关进程的Cpu使用率的信息。以下在linux man文档中对ps命令输出中有关cpu使用率的解释:
CPU usage is currentlyexpressed as the percentage of time spent running during the entire lifetime ofa process. This is not ideal, and it does not conform to the standards that psotherwise conforms to. CPU usage is unlikely to add up to exactly 100%.
%cpu cpu utilization of the process in”##.#” format. It is the CPU time used divided by the timethe process has been running (cputime/realtime ratio), expressed as apercentage. It will not add up to 100% unless you are lucky.
结论5:ps命令算出来的cpu使用率相对于进程启动时的平均值,随着进程运行时间的增大,该值会趋向于平缓。
top命令
通过top命令可以查看系统中相关进程的实时信息(cpu使用率等)。以下是man文档中对top命令输出中有关进程cpu使用率的解释。
#C — Last used CPU (SMP) Anumber representing the last used processor. In a true SMP environment this will likely change frequently since the kernel intentionally usesweak affinity. Also, the very act ofrunning top may break this weak affinity and cause more processes to change CPUs more often (because of the extra demand for cputime).
%CPU — CPUusage The task’s share ofthe elapsed CPU time since the last screen update, expressed as a percent-ageof total CPU time. In a true SMP environment, if Irix mode is Off, top will operate in Solaris modewhere a task’s cpu usage will be divided by the total number of CPUs.
结论6:某一个线程在其运行期间其所使用的cpu可能会发生变化。
结论7:在多核的情况下top命令输出的cpu使用率实质是按cpu个数*100%计算的。
单核情况下Cpu使用率的计算
基本思想
通 过读取/proc/stat 、/proc/<pid>/stat、/proc/<pid>/task/<tid>/stat以及/proc /cpuinfo这几个文件获取总的Cpu时间、进程的Cpu时间、线程的Cpu时间以及Cpu的个数的信息,然后通过一定的算法进行计算(采样两个足够 短的时间间隔的Cpu快照与进程快照来计算进程的Cpu使用率)。
总的Cpu使用率计算
计算方法:
1、 采样两个足够短的时间间隔的Cpu快照,分别记作t1,t2,其中t1、t2的结构均为:
(user、nice、system、idle、iowait、irq、softirq、stealstolen、guest)的9元组;
2、 计算总的Cpu时间片totalCpuTime
a) 把第一次的所有cpu使用情况求和,得到s1;
b) 把第二次的所有cpu使用情况求和,得到s2;
c) s2 – s1得到这个时间间隔内的所有时间片,即totalCpuTime = j2 – j1 ;
3、计算空闲时间idle
idle对应第四列的数据,用第二次的第四列- 第一次的第四列即可
idle=第二次的第四列- 第一次的第四列
6、计算cpu使用率
pcpu =100* (total-idle)/total
某一进程Cpu使用率的计算
计算方法:
1. 采样两个足够短的时间间隔的cpu快照与进程快照,
a) 每一个cpu快照均为(user、nice、system、idle、iowait、irq、softirq、stealstolen、guest)的9元组;
b) 每一个进程快照均为 (utime、stime、cutime、cstime)的4元组;
2. 分别根据结论2、结论3计算出两个时刻的总的cpu时间与进程的cpu时间,分别记作:totalCpuTime1、totalCpuTime2、processCpuTime1、processCpuTime2
3. 计 算该进程的cpu使用率pcpu = 100*(processCpuTime2 – processCpuTime1) / (totalCpuTime2 – totalCpuTime1) (按100%计算,如果是多核情况下还需乘以cpu的个数);
实验数据
|
实验一: 监控一空循环的进程的cpu使用率。 |
|
|
说明:左边的数据是按以上算法得到的数据,其中采样的时间间隔与top命令刷新屏幕的时间间隔相同。 |
|
|
按以上方法计算得到的cpu使用率 |
通过top命令得到的 |
|
99.50083 98.333336 98.0 98.83138 99.0 99.0 99.83361 98.83527 98.4975
|
PID USER PR NI VIRT RES SHR S %CPU %MEM TIME+ COMMAND
7639 fjzag 20 0 206m 10m 7136 S 99 2.2 1:00.74 java 7639 fjzag 20 0 206m 10m 7136 S 99 2.2 1:03.71 java 7639 fjzag 20 0 206m 10m 7136 S 99 2.2 1:06.67 java 7639 fjzag 20 0 206m 10m 7136 S 99 2.2 1:09.63 java 7639 fjzag 20 0 206m 10m 7136 S 98 2.2 1:12.59 java 7639 fjzag 20 0 206m 10m 7136 S 99 2.2 1:15.55 java 7639 fjzag 20 0 206m 10m 7136 S 100 2.2 1:18.55 java 7639 fjzag 20 0 206m 10m 7136 S 100 2.2 1:21.54 java 7639 fjzag 20 0 206m 10m 7136 S 99 2.2 1:24.52 java 7639 fjzag 20 0 206m 10m 7136 S 98 2.2 1:27.46 java |
|
实验二: 监控jconsole进程的cpu使用率。 |
|
|
说明:左边的数据是按以上算法得到的数据,其中采样的时间间隔与top命令刷新屏幕的时间间隔相同。 |
|
|
按以上方法计算得到的cpu使用率 |
通过top命令得到的 |
|
8.681135 12.0 10.350584 7.6539097 7.6539097 5.0 13.021703 11.0 8.666667 |
PID USER PR NI VIRT RES SHR S %CPU %MEM TIME+ COMMAND
7753 fjzag 20 0 252m 72m 22m S 10 14.4 0:18.70 jconsole 7753 fjzag 20 0 252m 72m 22m S 12 14.4 0:19.07 jconsole 7753 fjzag 20 0 252m 72m 22m S 11 14.4 0:19.39 jconsole 7753 fjzag 20 0 252m 72m 22m S 7 14.4 0:19.61 jconsole 7753 fjzag 20 0 252m 72m 22m S 7 14.4 0:19.83 jconsole 7753 fjzag 20 0 252m 72m 22m S 5 14.4 0:19.97 jconsole 7753 fjzag 20 0 252m 72m 22m S 14 14.4 0:20.38 jconsole 7753 fjzag 20 0 252m 72m 22m S 10 14.4 0:20.68 jconsole 7753 fjzag 20 0 252m 72m 22m S 9 14.5 0:20.96 jconsole |
某一线程Cpu使用率的计算
计算方法:
1. 采样两个足够短的时间隔的cpu快照与线程快照,
a) 每一个cpu快照均为(user、nice、system、idle、iowait、irq、softirq、stealstealon、guest)的9元组;
b) 每一个线程快照均为 (utime、stime)的2元组;
2. 分别根据结论2、结论4计算出两个时刻的总的cpu时间与线程的cpu时间,分别记作:totalCpuTime1、totalCpuTime2、threadCpuTime1、threadCpuTime2
3. 计 算该线程的cpu使用率pcpu = 100*( threadCpuTime2– threadCpuTime1) / (totalCpuTime2– totalCpuTime1) (按100%计算,如果是多核情况下还需乘以cpu的个数);
实验数据
|
实验一: 监控一空循环的线程的cpu使用率。 |
|
|
说明:左边的数据是按以上算法得到的数据,其中采样的时间间隔与top命令刷新屏幕的时间间隔相同。 |
|
|
按以上方法计算得到的cpu使用率 |
通过top命令得到的 |
|
98.83138 97.00997 96.98997 97.49583 98.169716 96.8386 97.333336 93.82304 98.66667 |
PID USER PR NI VIRT RES SHR S %CPU %MEM TIME+ COMMAND
7649 fjzag 20 0 206m 10m 7136 R 97 2.2 7:22.94 java 7649 fjzag 20 0 206m 10m 7136 R 97 2.2 7:25.86 java 7649 fjzag 20 0 206m 10m 7136 R 97 2.2 7:28.76 java 7649 fjzag 20 0 206m 10m 7136 R 99 2.2 7:31.72 java 7649 fjzag 20 0 206m 10m 7136 R 98 2.2 7:34.65 java 7649 fjzag 20 0 206m 10m 7136 R 96 2.2 7:37.53 java 7649 fjzag 20 0 206m 10m 7136 R 98 2.2 7:40.47 java 7649 fjzag 20 0 206m 10m 7136 R 96 2.2 7:43.34 java 7649 fjzag 20 0 206m 10m 7136 R 97 2.2 7:46.25 java |
|
实验二: 监控jconsole程序某一线程的cpu使用率。 |
|
|
说明:左边的数据是按以上算法得到的数据,其中采样的时间间隔与top命令刷新屏幕的时间间隔相同。 |
|
|
按以上方法计算得到的cpu使用率 |
通过top命令得到的 |
|
1.3400335 6.644518 1.3333334 0.6677796 0.6666667 1.3333334 1.3333334 |
PID USER PR NI VIRT RES SHR S %CPU %MEM TIME+ COMMAND
7755 fjzag 20 0 251m 72m 22m S 1 14.4 0:11.92 jconsole 7755 fjzag 20 0 251m 72m 22m S 7 14.4 0:12.12 jconsole 7755 fjzag 20 0 251m 72m 22m S 2 14.4 0:12.18 jconsole 7755 fjzag 20 0 251m 72m 22m S 0 14.4 0:12.18 jconsole 7755 fjzag 20 0 251m 72m 22m S 1 14.4 0:12.20 jconsole 7755 fjzag 20 0 251m 72m 22m S 1 14.4 0:12.24 jconsole 7755 fjzag 20 0 251m 72m 22m S 1 14.4 0:12.28 jconsole |
多核情况下cpu使用率的计算
以下通过实验数据来说明多核情况下某一进程cpu使用率是按cpu个数*100%计算的.
实验一
描述:
在双核的情况下作的一组实验,第一组数据是通过ps -eLo pid,lwp,pcpu | grep 9140命令查看进程号为9140的进程中各线程的详细信息。第二组数据是通过 ps命令查看进程号为9140进程的cpu使用率。
数据一:
pid lwp %cpu
9140 9140 0.0
9140 9141 0.0
9140 9142 0.0
9140 9143 0.0
9140 9144 0.0
9140 9149 0.0
9140 9150 0.0
9140 9151 0.0
9140 9152 0.1
9140 9153 96.6 该线程是一个空循环
9140 9154 95.9 该线程是一个空循环
以上除了红色标注出来的两个线程以外,其他的线程都是后台线程。
数据二:
pid %cpu
9140 193
实验二
描述:
在单核的情况下作的一组实验,第一组数据是通过ps -eLo pid,lwp,pcpu | grep 6137命令查看进程号为6137的进程中各线程的详细信息。第二组数据是通过 ps命令查看进程号为6137进程的cpu使用率。
数据一:
pid lwp %cpu
6137 6137 0.0
6137 6138 0.1
6137 6143 0.0
6137 6144 0.0
6137 6145 0.0
6137 6146 0.0
6137 6147 0.0
6137 6148 0.0
6137 6149 0.0
6137 6150 46.9 空循环线程
6137 6151 46.9 空循环线程
以上除了红色标注出来的两个线程以外,其他的线程都是后台线程。
数据二
pid %cpu
6137 92.9
主要问题:
1. 不同内核版本/proc/stat文件格式不大一致。/proc/stat文件中第一行为总的cpu使用情况。
各个版本都有的4个字段: user、nice、system、idle
2.5.41版本新增字段:iowait
2.6.0-test4新增字段:irq、softirq
2.6.11新增字段:stealstolen: which is thetime spent in other operating
systems whenrunning in a virtualized environment
2.6.24 新增字段:guest: whichis the time spent running a virtual CPU for guest operating systems under the control ofthe Linux kernel
2./proc/pid/task目录是Linux 2.6.0-test6之后才有的功能。
3.关于出现cpu使用率为负的情况,目前想到的解决方案是如果出现负值,连续采样计算cpu使用率直到为非负。
4.有些线程生命周期较短,可能在我们采样期间就已经死掉了.
php-cgi进程占用cpu资源过多负载高的原因分析及解决步骤
服务器环境:redhat linux 5.5 , nginx , phpfastcgi
在此环境下,一般php-cgi运行是非常稳定的,但也遇到过php-cgi占用太多cpu资源而导致服务器响应过慢,我所遇到的php-cgi进程占用cpu资源过多的原因有:
1. 一些php的扩展与php版本兼容存在问题,实践证明 eAccelerater与某些php版本兼容存在问题,具体表现时启动php-cgi进程后,运行10多分钟,奇慢无比,但静态资源访问很快,服务器负 载也很正常(说明nginx没有问题,而是php-cgi进程的问题),解决办法就是从php.ini中禁止掉eAccelerater模块,再重启 php-cgi进程即可
2. 程序中可能存在死循环,导致服务器负载超高(使用top指令查看负载高达100+), 需要借助Linux的proc虚拟文件系统找到具体的问题程序
3. php程序不合理使用session , 这个发生在开源微博记事狗程序上,具体表现是有少量php-cgi进程(不超过10个)的cpu使用率达98%以上, 服务器负载在4-8之间,这个问题的解决,仍然需要借助Linux的proc文件系统找出原因。
4. 程序中存在过度耗时且不可能完成的操作(还是程序的问题),例如discuz x 1.5的附件下载功能: source/module/forum/forum_attachement.php中的定义
function getremotefile($file) {
global $_G;
@set_time_limit(0);
if(!@readfile($_G[‘setting’][‘ftp’][‘attachurl’].’forum/’.$file)) {
$ftp = ftpcmd(‘object’);
$tmpfile = @tempnam($_G[‘setting’][‘attachdir’], ”);
if($ftp->ftp_get($tmpfile, ‘forum/’.$file, FTP_BINARY)) {
@readfile($tmpfile);
@unlink($tmpfile);
} else {
@unlink($tmpfile);
return FALSE;
}
}
return TRUE;
}
没有对传入的参数作任何初步检查,而且设置了永不超时,并且使用readfile一次读取超大文件,就可能存在以下问题:
A. 以http方式读取远程附件过度耗时
B. FTP无法连接时,如何及时反馈出错误?
C. readfile是一次性读取文件加载到内存中并输出,当文件过大时,内存消耗惊人
根据实验发现采用readfile一次性读取,内存消耗会明显增加,但是CPU的利用率会下降较多。如果采用分段读取的方式,内存消耗会稍微下降,而CPU占用却会明显上升。
对discuz x 1.5的这个bug较好解决方法就是后台重新正确设置远程附件参数。
以下是我逐步整理的故障排除步骤:
1. 得到占用cpu资源过多的php-cgi进程的pid(进程id), 使用top命令即可,如下图:
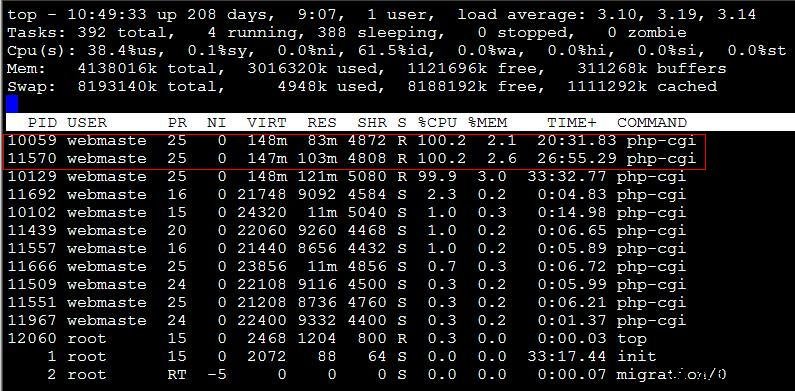
经过上图,我们发现,有两个php-cgi进程的cpu资源占用率过高,pid分别是10059,11570,这一般都是程序优化不够造成,如何定位问题的php程序位置?
2. 找出进程所使用的文件
/proc/文件系统保存在内存中,主要保存系统的状态,关键配置等等,而/proc/目录下有很多数字目录,就是进程的相关信息,如下图,我们看看进程10059正在使用哪些文件?
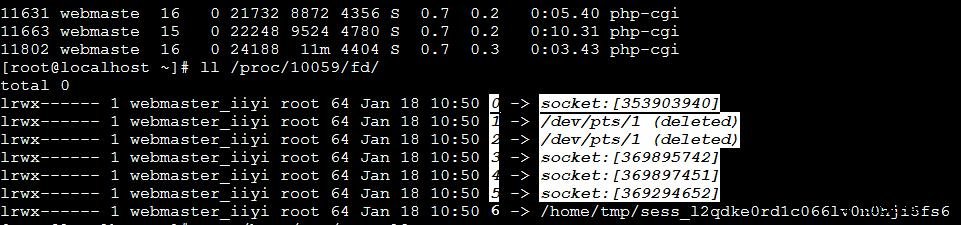
显然,使用了/home/tmp/sess_*文件,这明显是PHP的session文件, 我们查看这个session文件的内容为:view_time|123333312412
到 这里,我们已经可以怀疑是由于php程序写入一个叫view_time的session项而引起, 那么剩余的事件就是检查包含view_time的所有php文件,然后修改之(比如改用COOKIE),这实话, 这个view_time并非敏感数据,仅仅记录用户最后访问时间,实在没必要使用代价巨大的session, 而应该使用cookie。
3. 找出有问题的程序,修改之
使用vi编辑以下shell程序(假设网站程序位于/www目录下)
#!/bin/bash
find /www/ -name “*.php” > list.txt
f=`cat ./list.txt`
for n in $f
do
r=`egrep ‘view_time’ $n`
if [ ! “$r” = “” ] ; then
echo $n
fi
done
运行这个shell程序,将输出包含有view_time的文件, 对记事狗微博系统,产生的问题位于modules/topic.mod.class文件中
http://blog.csdn.net/turkeyzhou/article/details/6709953
http://www.cnblogs.com/cute/archive/2011/04/20/2022280.html
本文内容遵从CC版权协议, 可以随意转载, 但必须以超链接形式标明文章原始出处和作者信息及版权声明
网址: http://www.penglixun.com/tech/system/cpu_load_analyse.html
最近对我的本本(4核8线程)用top命令看系统状况出现了CPU利用率超过200%的情况,非常诧异,查了下相关资料,把这个问题弄清楚了。
首先来分析下CPU Load
load average: 0.09, 0.05, 0.01
分别是1分钟、5分钟、15分钟的平均Load。
Load这个东西怎么理解呢,就像一条马路,有N个车道,如果N个进程进入车道,那么正好一人一个,再多一辆车就占不到车道,要等有一个车空出车道。
在 CPU中可以理解为CPU可以并行处理的任务数,那么就是“CPU个数 * 核数”,如果CPU Load = CPU个数 * 核数 那么就是说CPU正好满负载,再多一点,可能就要出问题了,有任务不能被及时分配处理器,那么保证性能的话,最好是小于CPU个数 * 核数 *0.7。
查看CPU核数可以通过:grep ‘model name’ /proc/cpuinfo
那么以哪个平均值为准呢?如果1分钟平均出现大于CPU个数 * 核数的情况,还不用担心,如果5分钟平均也是,那就要警惕了,15分钟平均也是这样,就要分析哪里出问题了,防范于未然
CPU利用率超过100%的问题,也是差不多,top命令应该是把每个核的CPU占用率加起来,算一个和,于是多核情况下会出现超过100%。
另外Context Switch Rate也是个非常值得注意的值,因为线程间切换的代价也是非常高的。
引用一个公式:Context Switch Rate = Interrupt Rate + TPS* N
对于一个多线程的程序,我觉得准备一个控制线程来调度任务是非常必要的,免得线程过于高并发,导致资源的争用和线程切换带来性能问题,最好控制并发的线程数基本等于CPU的总核数,减少这个N,获得更好的处理器性能。
参考了如下几篇文章:
压力测试衡量CPU的三个指标:CPU Utilization、Load Average和Context Switch Rate
理解Load Average做好压力测试
理解 Linux 的处理器负载均值
高性能服务器架构
PS. 最近博客写得少,都要长草了。顺便赞一下阿里的食堂,比我们学校食堂四年不变菜饭还贵好多了。
|
查看文章
|
|
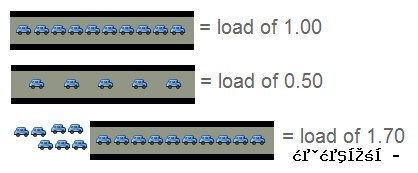
你可能对于 Linux 的负载均值(load averages)已有了充分的了解。负载均值在 uptime 或者 top 命令中可以看到,它们可能会显示成这个样子: load average: 0.09, 0.05, 0.01 很多人会这样理解负载均值:三个数分别代表不同时间段的系统平均负载(一分钟、五 分钟、以及十五分钟),它们的数字当然是越小越好。数字越高,说明服务器的负载越 大,这也可能是服务器出现某种问题的信号。 而事实不完全如此,是什么因素构成了负载均值的大小,以及如何区分它们目前的状况是 “好”还是“糟糕”?什么时候应该注意哪些不正常的数值? 回答这些问题之前,首先需要了解下这些数值背后的些知识。我们先用最简单的例子说明, 一台只配备一块单核处理器的服务器。 行车过桥 一 只单核的处理器可以形象得比喻成一条单车道。设想下,你现在需要收取这条道路的过桥 费 — 忙于处理那些将要过桥的车辆。你首先当然需要了解些信息,例如车辆的载重、以及 还有多少车辆正在等待过桥。如果前面没有车辆在等待,那么你可以告诉后面的司机通过。 如果车辆众多,那么需要告知他们可能需要稍等一会。 因此,需要些特定的代号表示目前的车流情况,例如: 0.00 表示目前桥面上没有任何的车流。实际上这种情况与 0.00 和 1.00 之间是相同的,总而言之很通畅,过往的车辆可以丝毫不用等待的通过。1.00 表示刚好是在这座桥的承受范围内。这种情况不算糟糕,只是车流会有些堵,不过这种情况可能会造成交通越来越慢。超过 1.00,那么说明这座桥已经超出负荷,交通严重的拥堵。那么情况有多糟糕? 例如 2.00 的情况说明车流已经超出了桥所能承受的一倍,那么将有多余过桥一倍的车辆正在焦急的等待。3.00 的话情况就更不妙了,说明这座桥基本上已经快承受不了,还有超出桥负载两倍多的车辆正在等待。
上面的情况和处理器的负载情况非常相似。一辆汽车的过桥时间就好比是处理器处理某线程 的实际时间。Unix 系统定义的进程运行时长为所有处理器内核的处理时间加上线程 在队列中等待的时间。 和收过桥费的管理员一样,你当然希望你的汽车(操作)不会被焦急的等待。所以,理想状态 下,都希望负载平均值小于 1.00 。当然不排除部分峰值会超过 1.00,但长此以往保持这 个状态,就说明会有问题,这时候你应该会很焦急。 “所以你说的理想负荷为 1.00 ?” 嗯,这种情况其实并不完全正确。负荷 1.00 说明系统已经没有剩余的资源了。在实际情况中 ,有经验的系统管理员都会将这条线划在 0.70: “需要进行调查法则”:如果长期你的系统负载在 0.70 上下,那么你需要在事情变得更糟糕之前,花些时间了解其原因。“现在就要修复法则”:1.00 。如果你的服务器系统负载长期徘徊于 1.00,那么就应该马上解决这个问题。否则,你将半夜接到你上司的电话,这可不是件令人愉快的事情。“凌晨三点半锻炼身体法则”:5.00。如果你的服务器负载超过了 5.00 这个数字,那么你将失去你的睡眠,还得在会议中说明这情况发生的原因,总之千万不要让它发生。 那么多个处理器呢?我的均值是 3.00,但是系统运行正常! 哇喔,你有四个处理器的主机?那么它的负载均值在 3.00 是很正常的。 在多处理器系统中,负载均值是基于内核的数量决定的。以 100% 负载计算,1.00 表示单个处理器,而 2.00 则说明有两个双处理器,那么 4.00 就说明主机具有四个处理器。
回到我们上面有关车辆过桥的比喻。1.00 我说过是“一条单车道的道路”。那么在单车道 1.00 情况中,说明这桥梁已经被车塞满了。而在双处理器系统中,这意味着多出了一倍的 负载,也就是说还有 50% 的剩余系统资源 — 因为还有另外条车道可以通行。 所以,单处理器已经在负载的情况下,双处理器的负载满额的情况是 2.00,它还有一倍的资源可以利用。 多核与多处理器 先脱离下主题,我们来讨论下多核心处理器与多处理器的区别。从性能的角度上理解,一台主 机拥有多核心的处理器与另台拥有同样数目的处理性能基本上可以认为是相差无几。当然实际 情况会复杂得多,不同数量的缓存、处理器的频率等因素都可能造成性能的差异。 但即便这些因素造成的实际性能稍有不同,其实系统还是以处理器的核心数量计算负载均值 。这使我们有了两个新的法则: “有多少核心即为有多少负荷”法则:在多核处理中,你的系统均值不应该高于处理器核心的总数量。“核心的核心”法则:核心分布在分别几个单个物理处理中并不重要,其实两颗四核的处理器 等于 四个双核处理器 等于 八个单处理器。所以,它应该有八个处理器内核。 审视我们自己 让我们再来看看 uptime 的输出 ~ $ uptime 23:05 up 14 days, 6:08, 7 users, load averages: 0.65 0.42 0.36 这是个双核处理器,从结果也说明有很多的空闲资源。实际情况是即便它的峰值会到 1.7,我也从来没有考虑过它的负载问题。 那么,怎么会有三个数字的确让人困扰。我们知道,0.65、0.42、0.36 分别说明上一分钟、最后五分钟以及最后十五分钟的系统负载均值。那么这又带来了一个问题: 我们以哪个数字为准?一分钟?五分钟?还是十五分钟? 其 实对于这些数字我们已经谈论了很多,我认为你应该着眼于五分钟或者十五分钟的平均数 值。坦白讲,如果前一分钟的负载情况是 1.00,那么仍可以说明认定服务器情况还是正常的。 但是如果十五分钟的数值仍然保持在 1.00,那么就值得注意了(根据我的经验,这时候你应 该增加的处理器数量了)。 那么我如何得知我的系统装备了多少核心的处理器? 在 Linux 下,可以使用 cat /proc/cpuinfo 获取你系统上的每个处理器的信息。如果你只想得到数字,那么就使用下面的命令: grep ‘model name’ /proc/cpuinfo | wc -l
原文: You might be familiar with Linux load averages already. Load averages are the three numbers shown with theuptimeandtopcommands – they look like this: load average: 0.09, 0.05, 0.01
Most people have an inkling of what the load averages mean: the three numbers represent averages over progressively longer periods of time (on First, a little background on what the load average values mean. We’ll start out with the simplest case: a machine with on The traffic analogy A single-core CPU is like a single lane of traffic. Imagine you are a bridge operator … sometimes your bridge is so busy there are cars lined up to cross. You want to let folks know how traffic is moving on your bridge. A decent metric would behow many cars are waitingat a particular time. If no cars are waiting, incoming drivers know they can drive across right away. If cars are backed up, drivers know they’re in for delays. So, Bridge Operator, what numbering system are you going to use? How about: 0.00 means there’s no traffic on the bridge at all. In fact, between 0.00 and 1.00 means there’s no backup, and an arriving car will just go right on.1.00 means the bridge isexactlyat capacity.All is still good, but if traffic gets a little heavier, things are going to slow down.over 1.00 means there’s backup.How much? Well, 2.00 means that there are two lanes worth of cars total — on
This is basically what CPU load is. “Cars” are processes using a slice of CPU time (“crossing the bridge”) or queued up to use the CPU. Unix refers to this as therun-queue length: the sum of the number of processes that are currently running plus the number that are waiting (queued) to run. Like the bridge operator, you’d like your cars/processes to never be waiting. So, your CPU load should ideally stay below 1.00. Also like the bridge operator, you are still ok if you get some temporary spikes above 1.00 … but when you’re consistently above 1.00, you need to worry. So you’re saying the ideal load is 1.00? Well, not exactly. The problem with a load of 1.00 is that you have no headroom. In practice, many sysadmins will draw a line at 0.70: The“Need to Look into it”Rule of Thumb:0.70If your load average is staying above > 0.70, it’s time to investigate before things get worse. The“Fix this now”Rule of Thumb:1.00. If your load average stays above 1.00, find the problem and fix it now. Otherwise, you’re going to get woken up in the middle of the night, and it’s not going to be fun. The“Arrgh, it’s 3AM WTF?”Rule of Thumb:5.0. If your load average is above 5.00, you could be in serious trouble, your box is either hanging or slowing way down, and this will (inexplicably) happen in the worst possible time like in the middle of the night or when you’re presenting at a conference. Don’t let it get there. What about Multi-processors? My load says 3.00, but things are running fine! Got a quad-processor system? It’s still healthy with a load of 3.00. On multi-processor system, the load is relative to the number of processor cores available. The “100% utilization” mark is 1.00 on a single-core system, 2.00, on a dual-core, 4.00 on a quad-core, etc. If we go back to the bridge analogy, the “1.00” really means “on
Same with CPUs: a load of 1.00 is 100% CPU utilization on single-core box. On a dual-core box, a load of 2.00 is 100% CPU utilization. Multicore vs. multiprocessor While we’re on the topic, let’s talk about multicore vs. multiprocessor. For performance purposes, is a machine with a single dual-core processor basically equivalent to a machine with two processors with on Which leads us to a two new Rules of Thumb: The “number of cores = max load”Rule of Thumb: on a multicore system, your load should not exceed the number of cores available. The“cores is cores”Rule of Thumb: How the cores are spread out over CPUs doesn’t matter. Two quad-cores == four dual-cores == eight single-cores. It’s all eight cores for these purposes. Bringing It Home Let’s take a look at the load averages output fromuptime: ~ $ uptime
23:05 up 14 days, 6:08, 7 users, load averages: 0.65 0.42 0.36 This is on a dual-core CPU, so we’ve got lots of headroom. I won’t even think about it until load gets and stays above 1.7 or so. Now, what about those three numbers? 0.65 is the average over the last minute, 0.42 is the average over the last five minutes, and 0.36 is the average over the last 15 minutes. Which brings us to the question: Which average should I be observing? On For the numbers we’ve talked about (1.00 = fix it now, etc), you should be looking at the five or 15-minute averages. Frankly, if your box spikes above 1.0 on the on So # of cores is imp cat /proc/cpuinfoto get info on each processor in your system.Note: not available on OSX, Google for alternatives. To get just a count, run it throughgrepand word count:grep ‘model name’ /proc/cpuinfo | wc -l |

 = load of 1.00
 = load of 0.50
 = load of 1.70
 = load of 2.00 on two-lane road
http://hi.baidu.com/moonlitshiny/blog/item/538fc10446fca5121c958341.html
http://www.penglixun.com/tech/system/cpu_load_analyse.html
tomcat cpu占用过高,系统负载高问题跟踪
线上8核 linux服务器,负载为8为正常情况,目前CPU负载过高,最高负载30多,平均负载在20左右,已经持续近一周,具体占用CPU资源的服务是tomcat_sc,占用CPU资源高达:720%
使用jconsole去跟踪
更改catalina.sh 启动设置:
$ CATALINA_OPTS=”-Dcom.sun.management.jmxremote -Dcom.sun.management.jmxremote.port=8933 -Dcom.sun.management.jmxremote.ssl=false -Dcom.sun.management.jmxremote.authenticate=false -Djava.rmi.server.hostname=$server_ip”;
import java.rmi.registry.LocateRegistry; imp ort javax.management.MBeanServer; imp ort javax.management.remote.JMXConnectorServer; imp ort javax.management.remote.JMXConnectorServerFactory; imp ort javax.management.remote.JMXServiceURL; imp ort java.io.IOException; imp ort java.lang.management.ManagementFactory; imp ort java.net.MalformedURLException; public class JmxTest { public static void main(String[] args) { MBeanServer mbeanServer = ManagementFactory.getPlatformMBeanServer(); JMXServiceURL url = null; try { url = new JMXServiceURL( "service:jmx:rmi://localhost:12199/jndi/rmi://localhost:8933/jmxrmi"); } catch (MalformedURLException e) { e.printStackTrace(); } JMXConnectorServer connectorServer = null; try { connectorServer = JMXConnectorServerFactory.newJMXConnectorServer(url, null, mbeanServer); } catch (IOException e) { e.printStackTrace(); } try { System.setProperty("java.rmi.server.randomIDs", "true"); LocateRegistry.getRegistry(8933); connectorServer.start(); } catch (IOException e) { e.printStackTrace(); } } }
hostname -i 为127.0.0.1
测试服务器配置完后,在本机使用jconsole连接,输入测试服务器帐号密码即可连上。网上资料说要改hostname,没有更改hostname也可行
线上先开了服务器端口,又开了 本机端口,telnet可以连上,但jconsole无法连接,查google,说:
the jvm you’re trying to connect to actually exposes *two* ports, the on
只开放了一个端口就不可以?必须外网服务器所有端口都对内网开放?继续跟踪。
jmap jconsole jstack都是java自带的jmx 问题跟踪工具, 可以学习一下帮助分析定位内存溢出 程序死锁之类的程序问题
使用 jmap 查看内存状况
jmap -histo:live pid
服务自建类的数量并不多
jstack 跟踪堆栈也没看出个所以然
继续jconsole调查 google “jconsole remote set random port to certain” 找到一篇像样的文章:
http://www.componative.com/content/controller/developer/insights/jconsole3/
于是写了servlet去注册指定端口 未果
在测试机上先试试 写java文件:
出现 java.rmi.AccessException: Cannot modify this registry 错误
注释掉 catalina.sh的启动设置 -Dcom.sun.management.jmxremote.port=8933 也不行
最终放弃了jconsole
使用 java.lang.management..ThreadMXBean
用焱哥转发 新阳提供的 jsp页面 分析性能问题,主要是看线程阻塞情况
主要代码:
ThreadMXBean tm = ManagementFactory.getThreadMXBean(); tm.setThreadContentionMonitoringEnabled(true); <% long [] tid = tm.getAllThreadIds(); ThreadInfo [] tia = tm.getThreadInfo(tid, Integer.MAX_VALUE); long [][] threadArray = new long[tia.length][2]; for (int i = 0; i < tia.length; i++) { long threadId = tia[i].getThreadId(); long cpuTime = tm.getThreadCpuTime(tia[i].getThreadId())/(1000*1000*1000); threadArray[i][0] = threadId; threadArray[i][1] = cpuTime; }
检测到如下线程问题:
Thread ID: 89
Thread Name: http-6080-Processor73
Thread State: RUNNABLE
Thread Lock Name: null
Thread Lock Owner Name: null
Thread CPU Time: 35678 sec
Stack Info: (depth:31)
+java.util.HashMap.get(HashMap.java:303)
+com.netqin.baike.server.nqrs.CloudSecurityCommand.writePkgsLog(CloudSecurityCommand.java:466)
+com.netqin.baike.server.nqrs.CloudSecurityCommand.execute(CloudSecurityCommand.java:153)
+com.netqin.baike.server.BaikeServer.service(BaikeServer.java:64)
+sun.reflect.GeneratedMethodAccessor33.invoke(Unknown Source)
CPU占用时间达到 35678秒 ,到下午到了50000秒左右,tomcat的CPU占用达到了200%
分析代码,发现是单例bean中使用了 hashmap 作为类对象,多线程访问时 类成员hashmap并不是线程安全的 非单例,引起了问题。更正代码后,几个月没有发现问题